CX Diminishing returns
CX as a Strategic asset rather than a Cost center – the concept of CX Diminishing returns and how to find the tipping point (spoiler alert, NPS is not a good indicator)….
There is a point at which additional CX investments yield diminishing returns—where further improvements in CX no longer translate into meaningful financial or strategic benefits.
This article explores the concept of CX diminishing returns, examining the threshold beyond which enhancements to CX provide little to no incremental value to the business. While early-stage CX improvements often result in significant gains, excessive investment beyond a certain level may lead to inefficiencies, inflated costs, and even customer indifference. Drawing on economic principles, I am keen to better understand and analyze the CX value curve and identify the optimal balance between CX investment and business outcomes.
Without clear alignment between CX initiatives and financial outcomes, organizations risk over-investing in experience improvements that do not translate into revenue growth, cost efficiencies, or long-term profitability. To ensure that CX remains a Strategic asset rather than a cost center, businesses must establish a clear link between CX enhancements and measurable business impact.
And by understanding the tipping point of CX diministing returns, organizations can make informed decisions about where to allocate resources, ensuring that CX strategies are both impactful and financially sustainable.
Identify CX diminishing returns
To ensure CX investments remain efficient and impactful, organizations need a structured approach to determining when they have reached the point of diminishing returns. This tipping point occurs when additional CX improvements no longer drive meaningful financial or strategic benefits, making it critical for businesses to measure and analyze the relationship between CX enhancements and business outcomes.
By measuring the percentage change in financial outcomes (such as revenue growth, customer retention, or cost savings) against the percentage change in CX metrics, organizations can gauge the efficiency of their CX investments. Organizations can also assess marginal gains versus cost to determine whether additional CX investments remain financially justified.
By plotting CX spending against key business performance indicators—such as revenue growth, customer lifetime value, or churn reduction—it becomes possible to identify when the impact of CX improvements starts to plateau. If a 10% increase in CX investment results in less than a 1% improvement in key business metrics, it is a strong indication that returns are diminishing. Similarly, if the cost of improving CX surpasses the revenue gained from those improvements, the business has likely crossed the efficiency threshold and should reconsider its investment strategy.
How to find the tipping point – measure CX impact
While improving CX can initially create a significant competitive advantage, there comes a point where customers expect these high standards as the norm rather than a differentiating factor. Organizations often use key (proxy) indicators such as Customer Effort Score (CES), Net Promoter Score (NPS), and Customer Satisfaction (CSAT) to track whether additional investments are still influencing customer perception.
This raises an interesting topic about NPS. NPS is one of the most widely used Customer Experience metrics, but when evaluating diminishing returns in CX, its effectiveness as a sole measure becomes questionable. While NPS provides insights into customer sentiment and loyalty, it has limitations in assessing whether additional CX investments are yielding business value.
An organization may see an increase in NPS without experiencing higher sales, reduced churn, or improved profitability, making it an unreliable metric for assessing the true impact of CX investments.
NPS also tends to plateau as CX improves, meaning that further enhancements may not result in meaningful changes in score, even if significant resources are spent. This makes it difficult for businesses to determine when they have reached the point of diminishing returns on their CX investments. Next, NPS does not account for cost efficiency—two organizations could achieve similar NPS scores, but one might be spending significantly more on CX, leading to lower margins and wasted resources.
Another key limitation is that NPS is subject to expectation inflation. As organizations enhance their CX, customers begin to see high-quality experiences as the standard rather than a differentiator. This means that maintaining or increasing NPS may require continuous investment without a proportional return.
Why NPS in the board? Why are most organizations still betting on NPS? As a single-number metric, it provides an intuitive way to gauge customer sentiment without requiring deep data analysis. Executives and board members, who often oversee multiple business functions, appreciate the clarity of a straightforward score that tracks customer loyalty over time. This simplicity makes it appealing as a high-level CX KPI, even if it lacks depth in explaining business impact. Other reasons I often hear:
Boards can compare their company’s performance against competitors, which helps in assessing relative CX success
Many organizations have tied NPS to executive compensation, investor presentations, and quarterly performance reviews
The belief that customer satisfaction translates to loyalty, and that loyalty drives revenue, is a compelling narrative.
Despite these reasons, forward-thinking boards are beginning to question NPS as a standalone measure and are exploring more financially grounded CX metrics. Instead of NPS, more and more organizations are using (other proxy) indicators like customer lifetime value (CLV), churn reduction, and cost-to-serve efficiency.
Connect CX with business outcomes – CX Index framework
Over the past two years, I have been conducting interviews with CX leaders, reading papers, articles, using ChatGPT to challenge assumptions and hypothesis. Based on these insights, I have developed an CX Index that provides a structured way to measure the financial return on investments in Customer Experience (CX). It quantifies the relationship between CX improvements and business outcomes, such as revenue growth, customer retention, and profitability. By calculating the percentage change in financial metrics relative to the percentage change in CX metrics organizations can assess the effectiveness of their CX investments.
The CX Index framework is designed to bridge the gap between customer experience (CX) and financial performance, providing organizations with a clear, data-driven approach to demonstrate how CX initiatives can directly impact business outcomes. The framework focuses on five key dimensions that are not only central to customer relationships but are also highly correlated with sustained revenue growth, operational efficiency, and long-term brand equity.
These five dimensions are essential because they represent the most direct and measurable links between CX improvements and business performance.
Customer Lifetime Value (CLV) Reflects the long-term revenue potential from each customer. A focus on CX improvements here leads to higher customer satisfaction, loyalty, and increased cross-sell/upsell opportunities
Pipeline Growth Accelerates sales cycles and increases lead conversion rates, enabling businesses to capture more value from each customer interaction
Retention Growth Emphasizes reducing churn and maximizing renewals, which are critical for long-term revenue stability
Advocacy Measures the impact of delighted customers on brand-driven sales and referrals, acting as a powerful growth lever
Operational Efficiency Drives cost savings by streamlining CX-related processes, improving customer service, and reducing resource waste
The reason these dimensions stand out is that they are not abstract or difficult to quantify—each one can be directly measured and tied to specific business outcomes. CLV directly correlates with revenue, Pipeline Growth is directly linked to sales effectiveness, Retention Growth impacts profit margins, and Operational Efficiency reduces costs, all of which can be tracked over time. Advocacy is a powerful feedback loop that turns satisfied customers into vocal promoters, generating new opportunities and driving organic growth.
What makes the framework particularly effective is its ability to show how improvements in customer experience—whether through better service, personalized experiences, or efficient problem resolution—drive tangible financial results. By focusing on these dimensions, organizations can confidently justify CX investments, create a strong business case, and align CX initiatives with broader strategic objectives.
Whether you’re in SaaS, retail, healthcare, financial services, or manufacturing, the fundamental drivers of Customer Lifetime Value (CLV), Pipeline Growth, Retention Growth, Operational Efficiency, and Advocacy remain consistent. These elements are not tied to a specific product or service type but are instead tied to the relationship a business has with its customers and how well it nurtures and sustains those relationships.
CX diminishing returns
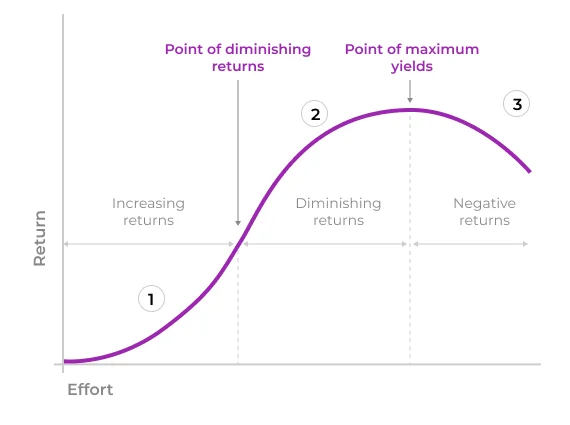
The graph above illustrates how CX investments initially lead to strong financial returns but eventually experience diminishing returns. As investments increase, the curve shows an upward trajectory at first, where each additional CX improvement brings substantial benefits. However, after a certain point (marked by the red dashed line), the returns start to decrease. This is the point where diminishing returns set in, and the curve eventually levels off, indicating that further CX investments yield progressively smaller financial improvements, as shown by the green dashed line representing the plateau.
By tracking this pattern with the CX Index framework, organizations can better understand when to optimize CX investments and avoid overspending on improvements that no longer justify the cost
References Anderson, E. W., Fornell, C., & Lehmann, D. R. (1994). “Customer satisfaction, market share, and profitability: Findings from Sweden.” Journal of Marketing, 58(3), 53-66.
Homburg, C., Jozić, D., & Kuehnl, C. (2017). “Customer experience management: Toward implementing an evolving marketing concept.” Journal of the Academy of Marketing Science, 45(3), 377-401.
Lemon, K. N., & Verhoef, P. C. (2016). “Understanding customer experience throughout the customer journey.” Journal of Marketing, 80(6), 69-90.
Meyer, C., & Schwager, A. (2007). “Understanding customer experience.” Harvard Business Review, 85(2), 116-126.
Rust, R. T., & Zahorik, A. J. (1993). “Customer satisfaction, customer retention, and market share.” Journal of Retailing, 69(2), 193-215.